
RDMA Performance Tuning: From Fresh Install to Line-Rate Bandwidth
The number-one complaint with RDMA is simple: the bandwidth won’t fill up. A 100G card pushing only 60G, two days spent checking drivers, optics, and the peer’s configuration — and in the end the fix is a single PCIe parameter.
When RDMA underperforms, 90% of the time the cause is not exotic. It’s some factory default that was never touched: the switch buffer carved too small, the PCIe read request size left at its tiny default, the MTU misaligned on one segment of the path. None of these is hard to fix on its own — the hard part is knowing which one to check.
This post is organized in four parts. Part 1 is the complete path from “card just arrived” to “bandwidth at line rate”: seven checks in order, a one-shot tuning script, and a fault-isolation table to come back to the next time RDMA is slow. Part 2 covers the other classic complaint — packet loss — with a five-step triage ordered by how often each cause is actually the culprit; the first three steps resolve about 70% of cases. Part 3 takes over when the triage runs dry: packet capture with tcpdump and Wireshark, through the four HPC cases that most often end in a pcap. Part 4 is the reference to come back to — capture- and display-filter cookbooks, the classic packet-analysis mistakes, and an incident workflow.
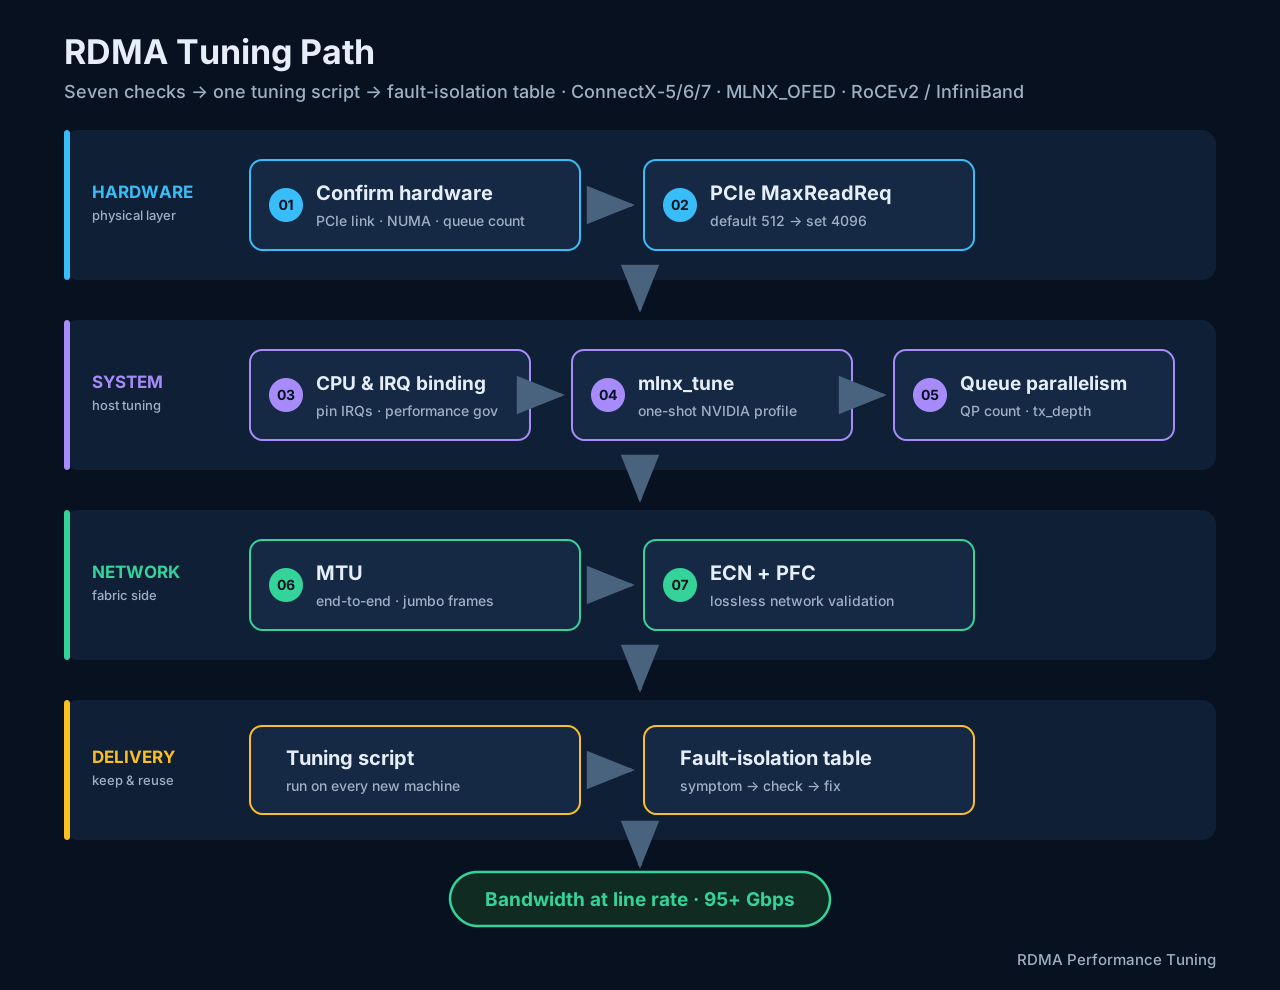
Applies to: ConnectX-5/6/7 · MLNX_OFED · RoCEv2 / InfiniBand
This is research from internet, could not verify in lab due to hardware limitation. May not be accurate.
Part 1 — Tuning: from fresh install to line rate
01 — Confirm the hardware
Rule out the physical layer first.
Is the card even recognized?
$ ibstat
CA 'mlx5_0'
        CA type: MT4123
        Number of ports: 1
        Firmware version: 20.36.1010
        Hardware version: 0
        Node GUID: 0x08c0eb0300a1b2c4
        System image GUID: 0x08c0eb0300a1b2c4
        Port 1:
                State: Active
                Physical state: LinkUp
                Rate: 100
                Base lid: 0
                LMC: 0
                SM lid: 0
                Capability mask: 0x00010000
                Port GUID: 0x0ac0ebfffea1b2c4
                Link layer: Ethernet
What to read in it:
- One
CA 'mlx5_X'block per PCIe function — a dual-port card showsmlx5_0andmlx5_1(the.0/.1functions from the BDF note below). No output, or a missing adapter, means driver/firmware problems — stop and fix that first. State: Active+Physical state: LinkUp— the port is up and usable.Down/Pollingpoints at the cable, the optic, or the peer port.Rate: 100— the negotiated speed in Gb/s; it should match what you paid for. A 100G card showingRate: 25or50has a cable/optic/negotiation problem before any tuning matters.Link layer: Ethernet— this is a RoCE setup;InfiniBandhere would mean the port is running IB mode instead (how to check and switch the RoCE mode is covered in section 4.1 of the RoCEv2 end-to-end post).Base lid: 0/SM lid: 0are normal on Ethernet — LIDs only exist on InfiniBand fabrics.
What <BDF> means. Used throughout this post, <BDF> is the NIC’s PCIe address — Bus:Device.Function:
0000 : 41 : 00 . 0
  │     │    │   └── function number (one per port on a dual-port NIC)
  │     │    └────── device number
  │     └─────────── PCI bus number
  └───────────────── PCI domain (almost always 0000, often omitted)
Find it from the interface name via the bus-info field:
$ ethtool -i ens1np0 | grep bus-info
bus-info: 0000:41:00.0

# Capture it in a variable - the tuning script below does exactly this
BDF=$(ethtool -i ens1np0 | awk '/bus-info/ {print $2}')
Or list the NVIDIA/Mellanox devices directly:
$ lspci -D | grep -Ei 'mellanox|nvidia'
0000:41:00.0 Ethernet controller: Mellanox Technologies MT28908 Family [ConnectX-6]
0000:41:00.1 Ethernet controller: Mellanox Technologies MT28908 Family [ConnectX-6]
Two functions (.0/.1) are the two ports of a dual-port card — tune the one your interface actually maps to.
PCIe link state — this is the one that matters most:
lspci -vv -s <BDF> | grep -E "Width|Speed"
You must see:
| NIC | Width | Speed |
|---|---|---|
| ConnectX-6 | x16 | 16GT/s (Gen4) |
| ConnectX-7 | x16 | 32GT/s (Gen5) |
If the output contains downgraded, the link is degraded and bandwidth will never reach line rate. Common causes: the card isn’t fully seated, the BIOS has the slot pinned to Gen3, or the slot shares lanes with a GPU.
NUMA alignment:
ibv_devinfo -d mlx5_0 | grep numa
NIC on NUMA node 1 while the application runs on NUMA node 0? Cross-NUMA latency will hurt — a lot. This trap is especially easy to step into on dual-socket servers. (And it isn’t about inter-socket bandwidth — it’s the extra hop cost per operation. At high rates, every extra step is wasted performance.)
Max out the RX/TX queues:
ethtool -l <iface>
ethtool -L <iface> combined <max>
02 — PCIe MaxReadReq
The factory default is 512 bytes — far too small for large RDMA transfers.
# Check the current value
sudo lspci -vv -s <BDF> | grep -i MaxRead
#   ... MaxPayload 256 bytes, MaxReadReq 512 bytes
MaxReadReq lives in bits 14:12 of the PCIe Device Control register, and the encodings are 0 = 128B up through 5 = 4096B. The safe way to change it is a read-modify-write that touches only those three bits, using setpci’s symbolic capability addressing (CAP_EXP+08 = the Device Control register, wherever the PCIe capability happens to sit for this device):
# Set MaxReadReq to 4096 bytes (encoding 5), leaving every other bit alone
current=$(sudo setpci -s <BDF> CAP_EXP+08.w)
sudo setpci -s <BDF> CAP_EXP+08.w=$(printf '%04x' $(( (0x$current & ~(7<<12)) | (5<<12) )))

# Verify
sudo lspci -vv -s <BDF> | grep -i MaxReadReq
⚠️ Do not use the one-liner setpci -s <BDF> 68.w=5 that circulates in tuning guides (including this post’s source article). It has two flaws. First, it assumes the Device Control register sits at config-space offset 0x68 — true on ConnectX cards, where the PCIe capability starts at 0x60, but not guaranteed elsewhere. Second, and worse, .w=5 overwrites the entire 16-bit register with 0x0005: since MaxReadReq is bits 14:12, that actually sets it to 000 = 128 bytes — the opposite of the intent — while also clearing MaxPayload, relaxed ordering, and the error-reporting enables as collateral damage. The Mellanox-documented recipe has always been read-modify-write (change only the leading hex digit of the register value); the CAP_EXP form above is the same thing made portable.
Large-message bandwidth typically improves 10–20% after this change.
⚠️ The setting is lost on reboot. Add it to rc.local or wrap it in a systemd service.
03 — CPU and interrupt binding
cpupower frequency-set -g performance
systemctl stop irqbalance
set_irq_affinity_cpulist.sh 0-7 <iface>
You can skip this — but RDMA latency will then spike intermittently, and you’ll go crazy trying to find out why.
04 — mlnx_tune
NVIDIA’s official tuning tool, with preset profiles per scenario:
mlnx_tune -p HIGH_THROUGHPUT
It automatically tunes receive queue depth, interrupt coalescing, and ACK delay.
05 — Queue parallelism
A single QP has a bandwidth ceiling. The perftest defaults use only one QP, which cannot fill the pipe.
Baseline run:
ib_write_bw -d mlx5_0 --report_gbits -F -D 10
Multi-QP with large messages — the real performance:
ib_write_bw -d mlx5_0 -q 16 -t 128 -s 1000000 -n 100000 --report_gbits
Parameter reference:
| Parameter | Default | Recommended | Why |
|---|---|---|---|
-q (QP count) | 1 | 16–32 | Mandatory on high-latency links |
-t (tx_depth) | 128 | 512–1024 | How many requests are posted at once |
-s (message size) | 65536 | 1000000+ | Bigger messages, higher throughput |
⚠️ Two pitfalls:
- On CX-6 DX, running more than 8 QPs causes MR cache thrashing and eats about 22% of throughput. Add
--mr_per_qp. - On CX-7, don’t let the total queue count across VFs exceed 32. Measured: 2 VF × 16 queues = 88.4 Mpps; 4 VF × 16 queues = 51.3 Mpps — cut in half.
What to expect from a 100G NIC:
| Scenario | You should see |
|---|---|
| Single QP, small messages | 40–60 Gbps |
| Multi-QP, large messages | 95+ Gbps |
| Both ports simultaneously | 190+ Gbps |
Measured on DGX Spark + CX-7: ib_send_bw -s 1048576 -q 8 -r 1024 -Q 64 → 93–95 Gbps.
06 — MTU
The highest-hit-rate trap on the network side. The switches are configured for jumbo frames, but one Leaf-to-Spine uplink was forgotten. One wrong segment ruins the whole path.
End-to-end verification — do not skip this:
ping -M do -s 8972 <peer_IP>
If it fails, check segment by segment: Leaf downlink, uplink, Spine port, VLAN interface. Missing any one of them breaks it.
Configuration:
# Host side
ip link set <iface> mtu 4200
# Switch side (Nexus example)
interface ethernet 1/1
  mtu 9216
⚠️ Bigger is not always better. Byte-jitter testing showed some NICs perform worse at 4KB MTU than 1KB under high connection counts. When a new card arrives, run ib_write_bw at 1KB / 2KB / 4KB and keep whichever wins.
07 — ECN + PFC validation
Check the network side if bandwidth still won’t climb after going through the first six steps.
# Switch: PFC trigger counters
show interface priority-flow-control

# NIC: ECN marks
ethtool -S <iface> | grep ecn
⚠️ PFC counters continuously climbing = something is misconfigured. On a healthy link PFC almost never fires.
Field-tested values, ready to use:
| Parameter | Recommended | Notes |
|---|---|---|
| PFC priority | Priority 3 only | For RoCE traffic — never enable all 8 |
| Buffer share | 10–20% | Don’t leave it at the 50% default |
| ECN threshold | Min 150KB / Max 1500KB | Configured on the switch |
| DCQCN ToS | DSCP × 4 | DSCP 24 → write 96 |
⚠️ Never let PFC and TCP share the same physical port. TCP retransmissions and PFC pause frames stack up and can deadlock PFC. Put RDMA on one port and TCP on another — physical isolation.
The tuning script
New machine comes online — run this:
#!/bin/bash
# Applies to: ConnectX-5/6/7 + MLNX_OFED v24+

# Interface to tune: first argument, or ens1np0 if none given
IFACE=${1:-ens1np0}
# Resolve the NIC's PCIe address (BDF) from the interface name
BDF=$(ethtool -i $IFACE | grep bus-info | awk '{print $2}')

# Pin all CPU cores at max frequency — no downclocking mid-transfer
cpupower frequency-set -g performance 2>/dev/null
# Stop the IRQ balancer so interrupts stop migrating between cores
systemctl stop irqbalance 2>/dev/null
# Pin the NIC's interrupts to cores 0-7 (same NUMA node as the NIC)
set_irq_affinity_cpulist.sh 0-7 $IFACE
# Jumbo frames — must match the switch config end to end
ip link set $IFACE mtu 4200
# PCIe MaxReadReq -> 4096 bytes (encoding 5): read-modify-write bits 14:12
# of the Device Control register via the PCIe capability (see section 02)
cur=$(setpci -s $BDF CAP_EXP+08.w)
setpci -s $BDF CAP_EXP+08.w=$(printf '%04x' $(( (0x$cur & ~(7<<12)) | (5<<12) )))
# Max out the RX/TX ring buffers to absorb bursts
ethtool -G $IFACE rx 8192 tx 8192
# Apply NVIDIA's throughput profile (queue depth, coalescing, ACK delay)
mlnx_tune -p HIGH_THROUGHPUT

echo "Done. Verify with:"
echo "ib_write_bw -d mlx5_0 -q 16 -t 128 --report_gbits -F -D 10"
Fault-isolation table
| Symptom | Check first | Fix |
|---|---|---|
| Bandwidth stuck at 40–50 Gbps | PCIe Width/Speed | Change slot / check BIOS / check power |
| PFC counters keep climbing | ECN threshold / MTU | Tune ECN / align MTU |
| CX-7 only pushing 13G | PCIe power delivery | Reseat cables, reboot |
| Multi-VF bandwidth halved | Total queue count > 32 | Fewer VFs or fewer queues |
| RDMA slower than TCP | Single-QP WR ceiling | More connections in parallel |
| Bandwidth oscillates | IRQ migration / CPU downclocking | Stop irqbalance, pin cores, performance governor |
| New machine won’t reach line rate | MTU misalignment | ping -M do segment by segment |
| Container slower than bare metal | NUMA binding / CNI MTU | topologyManager |
Three rows deserve a line of context each. CX-7 only pushing 13G: one-direction throttling caused by insufficient PCIe power delivery — drivers, firmware, and cables all check out fine; reseating all power cables and rebooting the node recovers it. RDMA slower than TCP: seen on 400G links, where a single QP’s outstanding-work-request ceiling caps RDMA throughput below what multi-stream TCP achieves — spreading the transfer across parallel connections (or a larger WR buffer) removes the cap. Container slower than bare metal: almost always broken NUMA affinity inside the pod — Kubernetes’ topologyManager with the single-numa-node policy restores the alignment that section 01 checks for on bare metal.
Part 2 — Packet loss: check the easy things first
A war story that sets the rule: on a freshly inherited cluster, RDMA bandwidth was stuck at half of what ib_write_bw should show. First suspicion was cabling — half a day spent reseating, swapping cables, and measuring optical power. The actual cause: one port on the peer switch still at the default MTU of 1500.
The habit that came out of it: when RDMA drops packets, start with what’s easiest to verify, not with what looks most likely. The order below is by real-world frequency — how often each step turns out to be the answer — not by textbook OSI layers. Knock out the 5-minute checks before going deep.
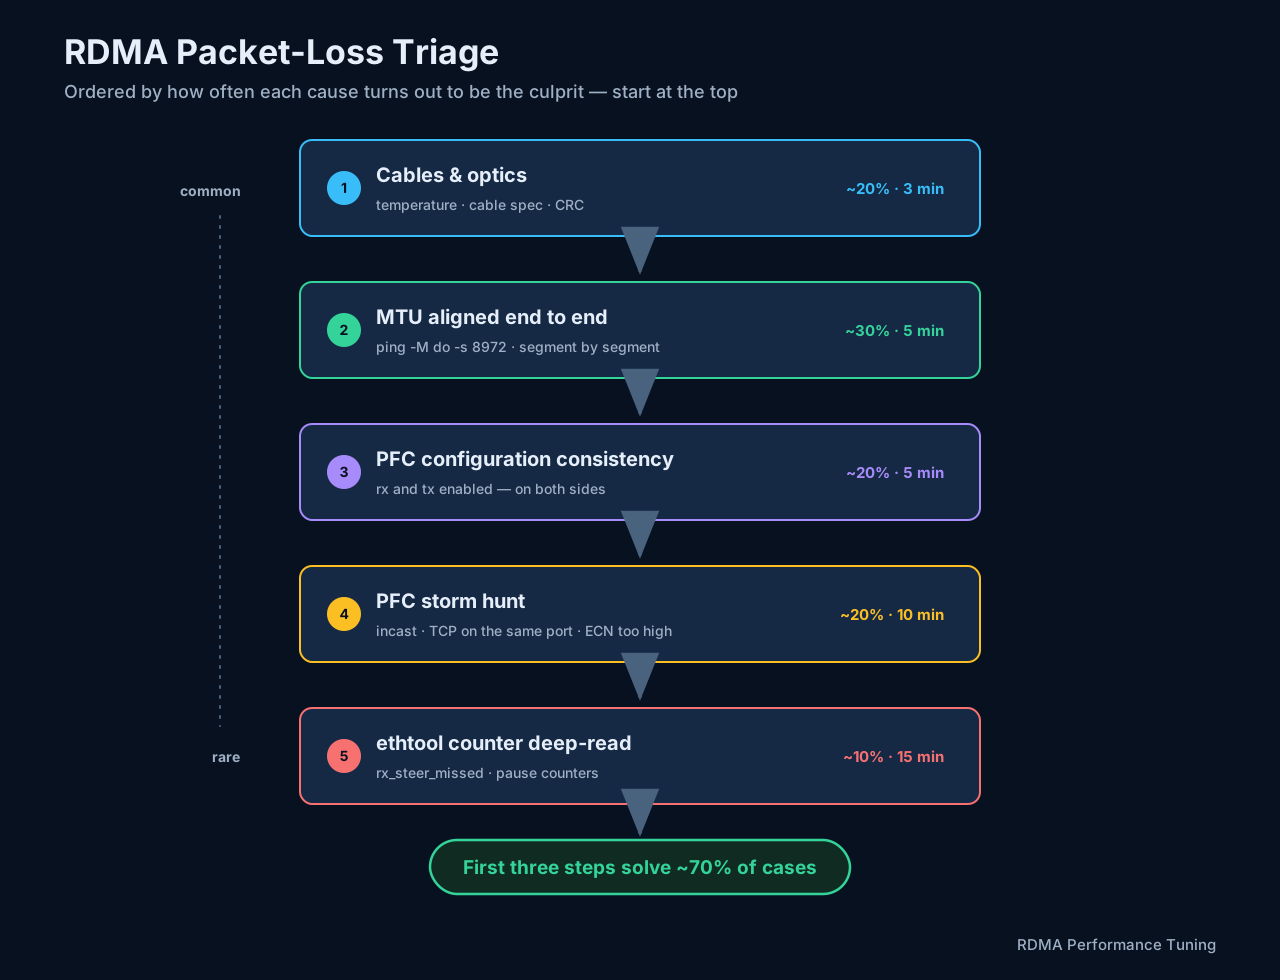
The 10-second precheck. Same hardware check as step 01 of Part 1 — ibstat and lspci -vv -s <BDF> | grep -E "Width|Speed". If the PCIe link shows downgraded, bandwidth is capped no matter what else you fix. It costs 10 seconds; always do it first.
Step 1 — Cables and optics (~20% of cases)
Transceiver temperature first:
# Cisco NX-OS
show interface ethernet 1/1 transceiver details

# Cumulus Linux
nv show interface swp1 transceiver
⚠️ Sustained above 60°C, the module’s performance degrades. Swapping cables won’t help here — fix the airflow or replace the module.
Then the cable spec. Buying the wrong cable grade is more common than you’d think: a QSFP28 cable used where QSFP56 was needed pins bandwidth at 50G; a certified cable brought it straight back to 100G+. The connectors look identical while the speed differs by 2× — read the label, not the shape.
Physical-layer signal quality:
ethtool <iface> | grep -i link
ethtool -S <iface> | grep -i crc
ethtool -S <iface> | grep -i error
cat /sys/class/infiniband/mlx5_0/ports/1/counters/symbol_error_counter
Verdict: CRC or error counters continuously climbing → the physical layer is the problem. Replace the cable or the optic.
Step 2 — MTU aligned end to end (~30% of cases)
The single highest hit rate on the list — and the same check as step 06 of Part 1:
ping -M do -s 8972 <peer_IP>
- ✅ Replies = MTU is consistent end to end.
- ❌ No reply = some segment is misaligned. Walk it hop by hop: Leaf downlink, uplink, Spine port, VLAN interface. A single path can cross four or five devices, and missing any one of them breaks it.
Configuration commands are in Part 1 step 06 (ip link set <iface> mtu 4200 on hosts, mtu 9216 on switch ports), along with the warning that bigger is not automatically better — race the candidate MTUs with ib_write_bw and keep the winner.
Step 3 — PFC configuration consistency (~20% of cases)
RoCE runs on a lossless network, and lossless is delivered by PFC. The most common PFC pit of all: it’s only enabled on one side. Both switches (Spine and Leaf) need it on, and both rx and tx must be enabled.
Cisco NX-OS:
show interface priority-flow-control

# Port       Mode     Oper(VL bmap)   RxPPP     TxPPP
# ---------  -------  -------------   -------   -------
# Eth1/1     ON       On(8)           4885      3709920
# Eth1/2     ON       On(8)           0         1073455
# Eth1/3     OFF      Off             0         0
Verdict: RxPPP and TxPPP continuously climbing → PFC is firing constantly, which is not a healthy state.
Cumulus Linux:
nv show interface swp1 qos roce status

# pfc
#   pfc-priority      3
#   rx-enabled        yes
#   tx-enabled        yes
Both sides must show rx/tx as on/yes — if either side is off, PFC simply doesn’t work.
⚠️ Occasional PFC triggering is normal. Continuous rapid growth means something is wrong — usually a mismatched ECN threshold or under-provisioned buffer.
Step 4 — PFC storm hunt (~20% of cases)
A PFC storm is sneakier than PFC being off: the configuration looks perfectly correct, but throughput won’t climb.
Locate the storming port — look for the ports with high TxPPP:
show interface priority-flow-control
The usual triggers:
- Incast — AllReduce-style many-to-one traffic overwhelms the buffer.
- RDMA and TCP mixed on one port — TCP retransmissions and PFC pause frames stack up on each other.
- ECN threshold set too high — ECN never gets the chance to slow senders down, so PFC fires first.
Confirm on the host side:
ethtool -S <iface> | grep pause
Once confirmed, the fixes point in three directions: check whether the ECN threshold is too high, keep PFC and TCP off the same physical port, and physically isolate RDMA traffic from everything else.
Step 5 — ethtool counter deep-read (~10% of cases)
The first four steps found nothing — time to read the NIC’s hardware counters.
The counter names below apply to the NVIDIA mlx5 driver; other vendors name them differently.
ethtool -S <iface> | grep -E "drop|discard|error|miss"
The ones to watch:
| Counter | Meaning |
|---|---|
rx_steer_missed_packets | Packet reached the NIC but matched no flow-steering rule |
rx_buff_alloc_err | Kernel buffer allocation failed |
rx_crc_errors_phy | Physical-layer CRC errors (cable/signal problem) |
outbound_pci_buffer_overflow | PCIe back-pressure |
PFC and RDMA statistics:
ethtool -S <iface> | grep -i pause
ethtool -S <iface> | grep rdma
⚠️ Totals alone tell you nothing — watch the delta while traffic is running. On a healthy link the PFC counters should barely move. If pause counters keep climbing, go back to steps 3 and 4.
Triage summary
| Order | What to check | Time | Hit rate |
|---|---|---|---|
| 1 | Cables & optics (temperature, spec, CRC) | 3 min | ~20% |
| 2 | MTU aligned end to end | 5 min | ~30% |
| 3 | PFC configuration consistency | 5 min | ~20% |
| 4 | PFC storm hunt | 10 min | ~20% |
| 5 | ethtool counter deep-read | 15 min | ~10% |
The first three steps already cover ~70% of cases.
The order is by frequency, not a mandatory sequence. In practice: if the first three steps come up empty, going straight to a packet capture is often more efficient than grinding through steps 4 and 5 — the later steps need much more information to be conclusive.
Most RDMA packet-loss tickets end at the most basic configuration, not anything deep. The hard part of the triage isn’t that any operation is complex — it’s doing them in the right order. Start with the complicated suspects and you burn hours; start with the 5-minute checks and most tickets never get past step 3.
Part 3 — Packet capture: tcpdump and Wireshark
When the triage above comes up empty, the capture is the ground truth. This part covers the four HPC cases that most often end in a pcap: diagnosing RoCEv2 packet loss, verifying that ECN-based congestion control is actually doing its job, confirming the traffic is classified into the right queue in the first place, and investigating PFC pause storms.
Use case 1 — Diagnose RoCEv2 packet loss
Typical symptoms that justify a capture:
ib_write_bwor NCCL performance suddenly drops- RDMA operations time out; retry counters increase
- GPU collective bandwidth varies between runs
- One server is consistently slower than its identical neighbors
- RoCE works at low load but fails under congestion
The kernel-bypass catch
Before running tcpdump, understand what it can and cannot see. RoCEv2 rides UDP/IP (destination port 4791), but RDMA’s whole point is bypassing the kernel networking path — the NIC moves data directly to and from application memory. A plain tcpdump on the Ethernet interface therefore often shows none of the RDMA data traffic, even while gigabits of it flow. Three ways around it:
Capture on the switch (SPAN/mirror session or a physical TAP) — the most reliable view of what is actually on the wire, and the only way to see hardware-consumed frames like PFC pauses (the same caveat as in the PFC frame decode).
Capture on the NIC’s RDMA device instead of the netdev. On supported NVIDIA ConnectX configurations, tcpdump can capture the offloaded traffic by pointing at the RDMA device rather than the Ethernet interface. First map one to the other:
$ rdma link show
$ ibdev2netdev
mlx5_0 port 1 ==> enp65s0f0 (Up)
Then capture from the RDMA device:
sudo tcpdump -i mlx5_0 -s 0 -nn \
  'udp port 4791' \
  -w roce-offloaded.pcap
NVIDIA documents this path for offloaded RoCE, VMA, and DPDK traffic — existing analyzers like tcpdump work once the capture point is the RDMA device. Whether
mlx5_0is exposed as a capture interface at all depends on the NIC generation, driver version, MLNX_OFED versus upstream drivers, the operating system, and which bypass technology the workload uses (RoCE, DPDK, VMA/XLIO, …) — so treat “the RDMA device doesn’t appear intcpdump -D” as a version problem, not proof the method is wrong.Accept the partial view. Control-plane traffic (ARP, CNPs on some configurations, anything kernel-mediated) still appears in ordinary captures and can be diagnostic on its own.
Capture with tcpdump
sudo tcpdump -i enp65s0f0 \
  -s 0 -nn -B 8192 \
  'udp port 4791' \
  -w roce.pcap
Flag by flag: -s 0 captures full packets instead of truncating (you want the BTH header and payload lengths intact), -nn skips DNS/port-name resolution (pointless latency during a fast capture), -B 8192 grows the capture buffer to 8 MB so tcpdump itself doesn’t drop packets under load, and -w writes raw pcap for Wireshark instead of decoding to text.
With VLAN tagging in the path:
sudo tcpdump -i enp65s0f0 \
  -s 0 -nn \
  'vlan and udp port 4791' \
  -w roce-vlan.pcap
The vlan keyword matters: once a filter encounters vlan, offsets shift by the 4-byte tag, so udp port 4791 alone silently misses tagged packets.
Analyze in Wireshark
Open the pcap and start from the RoCEv2 traffic:
udp.port == 4791
Narrow to one flow:
ip.src == 10.10.10.11 && ip.dst == 10.10.10.12 && udp.dstport == 4791
CNPs specifically (the congestion-feedback packets from the CNP decode):
udp.dstport == 4791 && infiniband.bth.opcode == 0x81
What to inspect in the InfiniBand BTH dissection:
- Queue Pair number — which connection this packet belongs to
- Packet Sequence Number (PSN) — gaps mean loss, repeats mean retransmission
- RDMA opcode — data (WRITE/SEND/READ), ACK/NAK, or CNP
- ACK versus NAK behavior — NAKs name the PSN where the receiver lost the stream
- ECN bits and DSCP — is the traffic marked as designed, and is anything arriving CE-marked?
Two-point captures: reading sender against receiver
One capture shows symptoms; two captures assign blame. Capture at both ends (or NIC and switch) and compare:
| Sender capture | Receiver capture | Likely interpretation |
|---|---|---|
| Packet appears | Packet appears | Fabric delivered it — look at the host |
| Packet appears | Packet missing | Loss between the capture points |
| Packet missing | Packet missing | Sender/NIC/application path, not the network |
| Packet transmitted early | Same packet arrives late | Fabric queuing or path delay |
| Duplicate transmission | Duplicate at receiver | Retry or network duplication |
| Correct DSCP at sender | DSCP changed at receiver | A hop in between is remarking — the QoS contract is broken |
The last row is worth emphasizing: a single switch that rewrites or zeroes DSCP silently pulls RoCE traffic out of its lossless class, and nothing but a two-point capture (or per-hop QoS counters) will show it.
Correlate with counters
A capture alone is never the full story — pair it with the counters on both hosts, ideally as deltas while the problem reproduces:
ethtool -S enp65s0f0          # NIC hardware counters (drops, discards, pause, ecn)
rdma statistic show           # per-QP/per-device RDMA counters
perfquery                     # InfiniBand port counters — needs an SM, so often
                              # empty on RoCE; there use rdma statistic or
                              # /sys/class/infiniband/*/ports/*/counters instead
nstat                         # kernel protocol counters
ip -s link show dev enp65s0f0 # interface-level drops/overruns
⚠️ At 40 Gbps and above, the capture host itself becomes a suspect: undersized NIC rings and insufficient host processing capacity drop packets during capture and manufacture phantom loss. Check per-queue drop counters, size the rings up (ethtool -G, as in the tuning script), and treat any capture-side drop counter above zero as “this pcap is not trustworthy evidence of fabric loss.”
Use case 2 — Verify ECN marking and congestion notification
RoCE congestion control (DCQCN) depends on the ECN relay working end to end: the sender stamps ECT(0), a congested switch flips it to CE, and the receiver returns a CNP that slows the sender (the full relay is walked through in the concepts post). A capture verifies each leg of that relay independently — which is exactly what the switch counters cannot do.
Capture. All RoCE traffic, as before:
sudo tcpdump -i enp65s0f0 -s 0 -nn \
  'udp port 4791' \
  -w roce-ecn.pcap
Or pre-filter to IP packets carrying a nonzero ECN value — ip[1] is the second byte of the IPv4 header (the DSCP+ECN byte), and & 0x03 masks the two ECN bits:
sudo tcpdump -i enp65s0f0 -s 0 -nn \
  'ip[1] & 0x03 != 0' \
  -w ecn.pcap
⚠️ On VLAN-tagged traffic the byte offset shifts, so the ip[1] trick misfires. When tags are in play, capture the whole flow and do the ECN analysis in Wireshark instead.
Wireshark filters. The ip.dsfield.ecn values map straight onto the codepoint table from the concepts post (0 = Not-ECT, 1 = ECT(1), 2 = ECT(0), 3 = CE):
ip.dsfield.ecn != 0                          # anything ECN-capable or CE-marked
ip.dsfield.ecn == 3                          # Congestion Experienced only
udp.dstport == 4791 && ip.dsfield.ecn == 3   # RoCE packets marked CE
Questions the capture should answer:
- Are RoCE packets entering the fabric as ECT-capable? (If the sender never stamps ECT(0), switches can only drop, never mark — the failure mode called out in the concepts post.)
- Which direction receives the CE marks?
- Does CE marking start only under high load, or is it constant?
- Are CNPs coming back? (
infiniband.bth.opcode == 0x81) - Does the sender visibly reduce its rate after CNPs arrive?
- Is ECN hitting one flow or many? One consistent spine/uplink, or everywhere?
Reading the result:
- CE marks appear before performance falls — the mechanism is working and the congestion is probably genuine. The fix is capacity or workload placement, not ECN configuration.
- Switch queues and ECN counters rise, but no CE-marked packets reach the endpoint — the relay is broken somewhere. Work the list: an ECN threshold set wrong (compare against the values in Part 1 step 07), a hop remarking the DSCP byte, QoS classification putting RoCE in a non-ECN class, the wrong traffic class carrying the ECN profile, a capture point that simply can’t see the marked packets (the kernel-bypass catch above), or switch buffer behavior masking the queue the profile watches.
Use case 3 — Verify RoCE DSCP and 802.1p classification
A common RoCE failure isn’t broken connectivity — it’s traffic landing in the wrong queue. The packets flow, ib_write_bw even passes at low load, but under congestion the “lossless” RoCE traffic is riding a best-effort queue with no PFC and no ECN, because a marking is wrong or a hop rewrote it. The capture proves what class the traffic is actually in at each point.
Capture — note the added -e, which records the Ethernet-layer header so the VLAN tag and its PCP bits are preserved:
sudo tcpdump -i enp65s0f0 -s 0 -e -nn \
  'udp port 4791' \
  -w roce-qos.pcap
Wireshark filters — using DSCP 24 / priority 3 as the expected contract (adjust to your design):
ip.dsfield.dscp == 24                        # the L3 marking
udp.dstport == 4791 && ip.dsfield.dscp == 24 # RoCE at the expected DSCP
vlan.priority == 3                           # the L2 (802.1p / PCP) marking
udp.dstport == 4791 && ip.dsfield.dscp == 24 && vlan.priority == 3   # both, together
That last filter is the useful one: it matches only packets marked correctly at both layers. Anything that falls out of the filter but is clearly RoCE is a classification problem.
Three-point capture — sender, server-facing switch mirror, receiver — and compare the markings at each:
| Capture point | Expect |
|---|---|
| Sender | DSCP 24 / PCP 3 |
| Switch egress (mirror) | DSCP 24 / PCP 3 |
| Receiver | DSCP 24 / PCP 3 |
If the packet leaves the sender with DSCP 24 but arrives with something else, a switch, router, hypervisor, or tunnel endpoint in between is remarking it — the same broken-QoS-contract signal as the DSCP row in the two-point loss table above.
What to keep straight while reading the capture (all covered in depth in the concepts post’s marking section):
- DSCP lives in the IP header; PCP lives in the VLAN tag. They are independent markings and a fabric can honor one while ignoring the other.
- An untagged frame has no PCP field at all — so
vlan.prioritymatches nothing, and the switch must be trusting DSCP. That is expected on routed/untagged server ports, not a fault. - A host can apply a DSCP-to-priority mapping internally even when the frame leaves untagged, so the NIC’s internal queue can be correct while there is no PCP on the wire.
- VXLAN adds a second, outer set of QoS markings. Inner and outer DSCP are separate; whether the outer inherits the inner is a fabric policy, and an underlay that classifies on the outer marking won’t see the tenant’s inner DSCP at all.
Use case 4 — Investigate PFC pause storms
PFC prevents loss for a chosen priority by pausing the upstream sender, but that pause is a blunt instrument: overused, it causes head-of-line blocking and spreads congestion backward through the fabric (the failure mode hunted in Part 1 step 07). A capture confirms the pause frames exist and which priority they target; counters measure the storm’s scale.
Capture — PFC frames are Ethernet MAC-control frames (EtherType 0x8808), not IP, so the filter is at the link layer and -e is required to see the source and the control fields:
sudo tcpdump -i enp65s0f0 \
  -s 0 -e -nn \
  'ether proto 0x8808' \
  -w pause.pcap
Wireshark — start here, then open the MAC Control opcode and the class-enable vector to see which priorities are paused and for how long:
eth.type == 0x8808
The frame layout, the 0x0101 opcode, the per-priority enable vector, and the pause-quanta-to-time conversion are decoded field by field in the concepts post’s PFC frame example.
Questions the capture should answer:
- Which endpoint or switch port is sending the pause frames? (The sender is the congested device asking others to stop.)
- Which priority is paused — and is it the RoCE priority (3 in this guide) or something unexpected?
- How long is each pause (the quanta value), and are pauses intermittent or continuous?
- Do the pauses line up in time with the RDMA latency spikes?
- Is a single congested receiver generating pauses that propagate upstream hop by hop?
Complementary counters — on the server:
ethtool -S enp65s0f0 | grep -Ei 'pause|pfc|prio'
On an NVIDIA/Cumulus switch, examine the per-priority pause RX/TX counters, buffer occupancy, queue drops, ECN marks, and interface congestion counters.
⚠️ The same caveat as the PFC frame decode: a capture proves PFC frames exist, but counters measure the storm better than a host capture does — pause frames are often consumed in hardware and never surface at an ordinary host capture point, so per-priority pause counters (watched as a delta while the problem reproduces) are the reliable measure of scale. A quiet host capture does not mean a quiet fabric.
Part 4 — Reference: filter cookbooks, mistakes, and workflow
The use cases above lean on a small set of filters and habits. This part collects them for reuse — the two filter languages are different (tcpdump/libpcap is a capture filter, applied before packets are stored; Wireshark is a display filter, applied after), so they are listed separately.
tcpdump capture-filter cookbook
A capture filter is one quoted argument on the tcpdump command line, usually placed last. The template used throughout this post:
sudo tcpdump -i <interface> -s 0 -nn -B 8192 '<filter>' -w <file>.pcap
The filter can sit before or after -w; both work, and placing it last often reads more cleanly:
sudo tcpdump -i enp65s0f0 -s 0 -nn -B 8192 -w host.pcap 'host 10.10.10.10'
The filters themselves, at a glance:
host 10.10.10.10                                  # one host, either direction
src host 10.10.10.10                              # sourced from a host
dst host 10.10.10.10                              # destined to a host
host 10.10.10.10 and host 10.10.10.20             # traffic between two hosts
udp and multicast                                 # any UDP multicast
udp and dst host 239.1.1.20 and dst port 18001    # one multicast feed
udp port 4791                                     # RoCEv2
tcp and host 203.0.113.20 and port 9001           # a specific TCP flow
udp port 319 or udp port 320 or ether proto 0x88f7  # PTP (event/general + L2)
ether proto 0x8808                                # PFC / Ethernet flow control
udp port 4789                                     # VXLAN
igmp                                              # IGMP
arp                                               # ARP
ip[6:2] & 0x3fff != 0                             # IPv4 fragments (MF set or offset != 0)
greater 1500                                      # frames of 1500 bytes or more (greater = >=)
The libpcap grammar behind these — host, net, port, length, and Ethernet/IP multicast primitives — is documented in pcap-filter(7).
Direction and combination. Every host/port primitive takes an optional src or dst qualifier, and and/or/not with parentheses combine them:
'src host 10.10.10.10'                  # only traffic from the host
'dst host 10.10.10.10'                  # only traffic to the host
'host 10.10.10.11 and host 10.10.10.12 and udp port 4791'   # RoCE between two hosts
'dst host 10.10.10.12 and udp dst port 4791'                # RoCE toward one server
'host 203.0.113.20 and tcp port 9001'                       # a host+port order-entry flow
'tcp dst port 9001'                     # inbound to a TCP port; 'tcp src port 9001' for outbound
Multicast feeds (market-data and similar) combine with or and parentheses — primary and backup in one capture:
'udp and
 ((dst host 239.10.10.1 and dst port 18001) or
  (dst host 239.20.20.1 and dst port 28001))'
IGMP alongside a feed answers “did the host join, and did the feed then arrive?” in one capture:
'igmp or (udp and dst host 239.1.1.20 and dst port 18001)'
VLAN-tagged traffic needs the vlan keyword — and note it shifts all subsequent offsets by the 4-byte tag, so filter terms come after it:
'vlan'                                  # any tagged frame (use -e to see the tag)
'vlan 20 and udp port 4791'             # RoCE on VLAN 20
⚠️ Depending on NIC VLAN offload, the tag may be stripped before tcpdump sees it, so vlan filters silently match nothing on otherwise-tagged traffic. Check with ethtool -k enp65s0f0 | grep -i vlan before trusting an empty result.
MTU and fragmentation:
'ip[6:2] & 0x3fff != 0'                 # IPv4 fragments (MF bit set or nonzero offset)
'icmp and icmp[0] == 3 and icmp[1] == 4' # ICMP "fragmentation needed" (PMTUD black-hole hunting)
'greater 1500'                          # frames >= 1500 bytes; add 'udp port 4791 and' for RoCE
Excluding noise with not keeps a capture readable — drop your own SSH session, or one chatty feed:
'host 10.10.10.10 and not tcp port 22'
'udp and multicast and not dst host 239.1.1.20'
Live display instead of a file — drop -w and add verbosity; useful for a quick look without a Wireshark round-trip:
sudo tcpdump -i enp65s0f0 -e -nn -vvv 'udp port 4791'          # decode to the terminal
sudo tcpdump -i enp65s0f0 -nn -tttt --time-stamp-precision=nano 'udp port 4791'  # ns timestamps (needs libpcap/NIC support)
sudo tcpdump -i enp65s0f0 -nn -XX 'udp and dst host 239.1.1.20'  # hex + ASCII payload
Bound the capture so it self-terminates — -c stops after N packets:
sudo tcpdump -i enp65s0f0 -s 0 -nn -c 1000 'udp port 4791' -w roce-1000.pcap
Three ready-to-run incident captures, combining the above:
# HPC RoCE — data plane plus PFC control frames, ns timestamps (where supported)
sudo tcpdump -i enp65s0f0 -s 0 -nn -e -B 16384 --time-stamp-precision=nano \
  -w roce-incident.pcap \
  'udp port 4791 or ether proto 0x8808'

# Market data — IGMP joins/queries plus both A/B feeds
sudo tcpdump -i enp65s0f0 -s 0 -nn -e -B 32768 --time-stamp-precision=nano \
  -w market-feed-incident.pcap \
  'igmp or
   (udp and dst host 239.10.10.1 and dst port 18001) or
   (udp and dst host 239.20.20.1 and dst port 28001)'

# VXLAN — one VTEP pair, captured on the fabric-facing port
sudo tcpdump -i swp1 -s 0 -nn -e -B 8192 \
  -w vxlan.pcap \
  'udp port 4789 and host 10.255.255.21 and host 10.255.255.22'
The one rule underneath all of it: sudo tcpdump <options> '<BPF capture filter>', and the filter combines with and / or / not and parentheses — '(condition-a or condition-b) and not condition-c'.
Wireshark display-filter cookbook
# TCP trouble
tcp.analysis.retransmission
tcp.analysis.fast_retransmission
tcp.analysis.duplicate_ack
tcp.analysis.out_of_order
tcp.analysis.zero_window
tcp.flags.reset == 1

# Timing (delta between captured packets — NOT application response time)
frame.time_delta_displayed > 0.001    # >1 ms since previous displayed packet
frame.time_delta > 0.0001             # >100 µs since previous captured packet

# QoS
ip.dsfield.dscp == 24
ip.dsfield.ecn == 3
vlan.priority == 3

# Multicast / RoCE / PTP / VXLAN
ip.dst == 239.1.1.20
igmp
udp.port == 4791
ptp
vxlan
vxlan && ip.addr == 192.168.20.100   # match on the inner flow inside VXLAN
The timing filters carry a trap worth repeating: the delta is between captured packets, not application response time — a large frame.time_delta can be capture jitter, not fabric latency (see the timestamp mistake below).
Common packet-analysis mistakes
- Capturing on
any.tcpdump -i anyis convenient but poor for latency work — it can capture the same packet at multiple stack points, may drop link-layer detail, and makes interface identity and direction ambiguous. Capture on the exact physical interface whenever precision matters. - Treating checksum errors as real corruption. With checksum offload enabled, the NIC computes checksums after tcpdump sees the packet, so captures routinely show “bad” checksums on locally sourced traffic. Verify offload state (
ethtool -k) before blaming the network. - Using a host capture as a wire timestamp. A software capture timestamp includes interrupt delay, NAPI polling delay, CPU scheduling, driver batching, and capture-process delay. For low-latency analysis use NIC hardware timestamps, switch timestamps, or a dedicated capture appliance.
- Not checking capture drops. A sequence gap in the pcap might be actual network loss, NIC receive loss, kernel capture loss, tcpdump process loss, or a disk-write bottleneck. Always correlate protocol gaps with tcpdump’s dropped-by-kernel count, NIC counters, switch counters, and application counters before calling it network loss.
- Capturing the wrong path. Kernel-bypass traffic often does not appear where expected — the recurring theme of Part 3. This affects RoCE, DPDK, VMA/XLIO, AF_XDP, FPGA NICs, and Onload-class stacks. Use the vendor’s offloaded-sniffer path.
- Concluding from one endpoint. A sender capture cannot show whether the receiver got the packet; a receiver capture cannot show whether the sender transmitted it. Two-point captures assign blame; one-point captures only show symptoms.
Recommended incident workflow
For an HPC/RoCE performance problem — record state, capture across the reproduction, then diff the counters:
# 1. Record interface and RDMA mappings
ip -br link
ip -br addr
ibdev2netdev
rdma link show

# 2. Record NIC settings and counters (before)
ethtool -k enp65s0f0
ethtool -g enp65s0f0
ethtool -l enp65s0f0
ethtool -S enp65s0f0 > ethtool-before.txt

# 3. Start a targeted capture
tcpdump -i enp65s0f0 -s 0 -nn -B 16384 \
  'udp port 4791' -w problem.pcap

# 4. Reproduce the problem

# 5. Record counters again (after) and diff against before
ethtool -S enp65s0f0 > ethtool-after.txt
rdma statistic show > rdma-after.txt
The before/after counter diff is the point of the whole exercise: the pcap shows what happened, the counter delta shows how much.
The same discipline applies outside RDMA — for a low-latency market-data feed-loss incident (see the low-latency network architecture post for that world), capture both A/B multicast feeds and the IGMP control traffic together:
tcpdump -i enp65s0f0 -s 0 -e -nn -B 32768 \
  'igmp or
   (udp and dst host 239.10.10.1 and dst port 18001) or
   (udp and dst host 239.20.20.1 and dst port 28001)' \
  -w feed-incident.pcap
Then answer, in order: did the host join both feeds; did both feeds arrive; where is the first sequence gap; did A or B carry the missing sequence; did tcpdump drop packets; did NIC RX queues drop; did switch counters report drops; did the application report the same gap? Each question rules a layer in or out.
Where capture time pays off most
For an HPC/RoCE network engineer, the highest-value captures — roughly in order — are:
- RoCE packet-sequence and retry analysis (use case 1)
- ECN and congestion-notification validation (use case 2)
- DSCP/PCP queue classification (use case 3)
- PFC pause analysis (use case 4)
- MTU and fragmentation problems (Part 1 step 06 and Part 2 step 2)
- TCP retransmissions for storage and control traffic
- NCCL/MPI incast and traffic-pattern analysis
- Sender-versus-receiver packet comparison — the technique that underlies most of the above